What meta-analysis features are available in Stata?
STATA ไม่มี Command สำหรับ Meta analysis
กล่มผู้ใช้' STATA จีงคิด Module เพิ่ม เป็นไฟล์ ado (Add on)
========================
Jonathan Sterne, University of Bristol
Ross Harris, University of Bristol
Roger Harbord, University of Bristol
Thomas J. Steichen, RJRT
========================
คำสั่งใน STATA 10 เพื่อ ติ
ดตั้ง Meta Analysis module
(Connect to Internet ก่อน ใช้คำสั่งบรรทัดต่อไป)
.ssc install metan
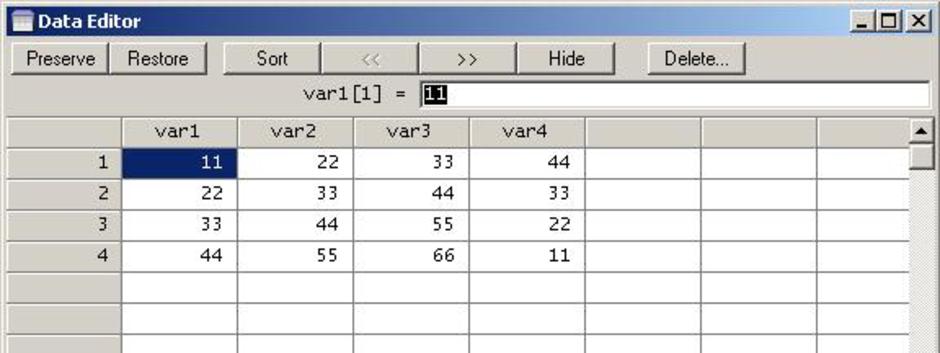
วิธีนำเข้าข้อมูล
Var1, Var2, Var3, Var4
11, 22, 33, 44
22, 33, 44, 33
33, 44, 55, 22
44, 55, 66, 11
.list
.metan var1 var2 var3 var4

Study_1 เป็น Cohort Study
a+b = 33 คน สัมผัสสิ่งที่คาดว่าก่อโรค ป่วย 11 คน (a) ไม่ป่วย 22 คน (b)
c+d = 77คน ไม่สัมผัสที่คาดว่าก่อโรค ป่วย 33 คน (c) ไม่ป่วย 44 คน (d)
Risk1 = 11/33
Risk2 = 33/77
Risk Ratio (RR) = (11/33) / (33/ 77) = (11 x 77) / (33 x 33) = 0.778
ถ้่า 95% CI มี 1 รวมอยู่ด้วยก็คือ RR มีโอกาสเป็น 1 ได้
คือไม่สามารถปฏิเสธ Ho คือ Risk1 และ Risk2 มีโอกาสที่จะไม่แตกต่างกัน
Study_1 RR = 0.778 เป็นปัจจัยป้องกัน แต่ 95% CI 0.4 ถึง 1.3 ไม่สามารถปฏิเสธ Ho
Study_2 RR = 0.700 เป็นปัจจัยป้องกัน แต่ 95% CI 0.4 ถึง 1.3 ไม่สามารถปฏิเสธ Ho
Study_3 RR = 0.600 เป็นปัจจัยป้องกัน และ 95% CI 0.4 ถึง 0.8 มีนัยสำคัญทางสถิติ
Study_4 RR = 0.519 เป็นปัจจัยป้องกัน และ 95% CI 0.4 ถึง 0.6 มีนัยสำคัญทางสถิติ
รวมทั้ง 4 Study Pooled RR = 0.6 และ 95% CI 0.5 ถึง 0.7
RR น้อยกว่า 1 จึงเป็นปัจจัยป้องกัน และ 95% CI ไม่คร่อมค่า 1 จึงแตกต่างกันอย่างมีนัยสำคัญทางสถิติ
Forest Plot

กราฟแนวนอน แสดง 95% CI ของ 4 Study เส้นแนวตั้ง คือเส้นที่ มีค่า = 1
บรรทัดบนสุด Study 1 คือ RR มีค่าน้อยกว่า 1 แต่ไม่มีนัยสำคัญทางสถิติ (95% CI คร่อมค่า 1)
บรรทัดที่ 2 Study 2 คือ RR มีค่าน้อยกว่า 1 แต่ไม่มีนัยสำคัญทางสถิติ (95% CI คร่อมค่า 1)
บรรทัดที่ 3, 4 Study 3 คือ RR มีค่าน้อยกว่า 1 อย่างนัยสำคัญทางสถิติ (95% CI ไม่คร่อมค่า 1)
Study 4 คือ RR มีค่าน้อยกว่า 1 อย่างนัยสำคัญทางสถิติ (95% CI ไม่คร่อมค่า 1)
บรรทัดที่ 5 ทั้ง 4 study รวมกัน (Meta Analysis) คือ RR มีค่าน้อยกว่า 1 และ 95% CI ไม่คร่อมค่า 1Exposure จึงเป็นปัจจัยป้องกันโรค อย่างนัยสำคัญทางสถิติ
STATA จะคำนวณ var1 var2 var3 var4 จาก Study 1-4 แบบ Cohort Study ได้ค่า Relative Risk
ถ้าเป็น Case Control Study ต้องการคำนวณ แบบ Odds Ratio จะต้องระบุ ,or ไว้ด้วย เช่น
.metan var1 var2 var3 var4,or
ตัวอย่าง
==================================================
Peto OR (95% CI Fixed) จาก 14 study 1972 - 1994
“จะป้องกัน neonatal death ได้หรือไม่ เมื่อให้ยา Coticosteroids
เปรียบเทียบกับให้ placebo หรือ no treatment ในกลุ่มผู้ป่วย premature"
ถ้าแยกแต่ละ study แล้วสรุปผลไม่ได้แน่ชัด
แต่ถ้ารวม 14 study แล้วการให้ยา coticosteroids ในกลุ่มผู้ป่วย premature
มีผลป้องกัน neonatal death ได้

รวมมี 14 Study 95%CI ไม่คร่อมค่า 1 และมีค่าน้อยกว่า 1
สรุปว่า Coticosteroids มีผลป้องกัน Neonatal Death
มีค่าสถิติ Peto OR 95% CI Fixed และ Chi-Square
http://www.cochrane.org/reviews/exreview.htm
==================================================
>> Home >> Resources & support >> FAQs >>
User-written packages for meta-analysis in Stata
What meta-analysis features are available in Stata?
|
Title |
User-written packages for meta-analysis in Stata |
|
Authors |
Jonathan Sterne, University of Bristol |
|
Date |
January 2007 |
Stata does not have a meta-analysis command. Stata users, however, have developed an excellent suite of commands for performing meta-analyses.
. meta
meta was the first Stata meta-analysis command. It requires the user to supply the treatment effect estimate and its standard error for each study. It uses inverse-variance weighting to derive fixed- and random-effects summary estimates of the treatment effect estimate.
The meta command has not been updated since 1998 and uses Stata 7 graphics. It is essentially redundant except that some other Stata meta-analysis commands require it to be installed.
To find out more, type the following in Stata:
. findit meta
. metan
The original version of the metan command used as input the cell frequencies from the 2 × 2 table for each study (for binary outcomes) or the mean and standard deviation in each group (for numerical outcomes). It provides a comprehensive range of methods for meta-analysis, including inverse-variance–weighted meta-analysis, and creates new variables containing the treatment effect estimate and its standard error for each study. These variables can then be used as input to several other Stata meta-analysis commands.
All the meta-analysis calculations available in metan are based on standard methods, an overview of which may be found in chapter 15 of Deeks, Altman, and Bradburn (2001).
metan has been updated on several occasions. Because it now allows the user to supply the treatment effect estimate and its standard error for each study, the command now has (almost) all the functionality of meta. Somewhat confusingly, the release of metan that added this facility was made available on the SSC archive in a package called metaaggr (meta-analysis of aggregate data). This may have meant that some users continued with older versions of the command.
Other important new facilities added include the by() option to conduct meta-analyses in subgroups and the recent update to Stata 9 graphics. The version of the metan command that used Stata 7 graphics has been renamed metan7 and is downloaded as part of the metan package currently available on the SSC archive.
The most recent help file for metan provides several clickable examples of using the command.
To find out more, type the following in Stata:
. ssc describe metan
To install the package, type the following in Stata:
. ssc install metan
. metafunnel
metafunnel displays funnel plots. It was released in 2004 and uses Stata 8 graphics. It requires the user to input the treatment effect estimate and its standard error for each study.
To find out more, type the following in Stata:
. ssc describe metafunnel
To install the package, type the following in Stata:
. ssc install metafunnel
mso-outline-level: 3;">
References
Begg, C. B., and M. Mazumdar. 1994.
Operating characteristics of a rank correlation test for publication bias. Biometrics 50: 1088–1101.
Deeks, J. J., D. G. Altman, and M. J. Bradburn. 2001.
Statistical methods for examining heterogeneity and combining results from several studies in meta-analysis. In Systematic Reviews in Health Care: Meta-Analysis in Context, 2nd Edition, ed. M. Egger, G. D. Smith, and D. G. Altman. London: BMJ.
Egger, M., G. D. Smith, M. Schneider, and C. Minder. 1997.
Bias in meta-analysis detected by a simple, graphical test. British Medical Journal 315: 629–634
========================
Jonathan Sterne, University of Bristol
Ross Harris, University of Bristol
Roger Harbord, University of Bristol
Thomas J. Steichen, RJRT
========================
นภดล
Link to: http://gotoknow.org/blog/epistat
เรียน อาจารย์หมอนภดล สรุป หน่อยครับ ชาวบ้านอย่าง JJ แปล ความ บ่ ถืก อะ
สบายดีนะครับ
ขอบคุณ ท่านอาจารย์ JJ ที่ช่วยถาม ให้ได้อธิบายเพ่มเติมครับ บทความมีอยู่ 3 ช่วงครับ
==================================
ช่วงตอนแรกสำหรับผู้ที่ติดตั้ง STATA ไว้แล้ว ถ้าต้องการจะใช้ Module ที่ทำ Meta Analysis จะมีวิธีติดตั้ง Add On (ado file) ตัวอย่่างการนำเข้าข้อมูล var1 var2 var3 var4 ด้วย Data Editor และตัวอย่างวิธีวิเคราห์ .metan var1 var2 var3 var4
==================================
ช่วงกลางเป็นตัวอย่าง การทำ Meta Analysis โดย The Cochrane Collaboration ตั้งแต่ 1972-1994 ใช้เวลาประมาณ 30 ปี เนื่องจากบาง Study 95% CI คร่อมค่า 1 จึงไม่มีนัยสำคัญทางสถิติ และใช้วิธี Meta Analysis จึงสรุปได้ว่า การให้ Steroid เป็นปัจจัยป้องกันการตายของ Neonatal Death ตัวแปรต้นคือการให้หรือไม่ให้ Steroid ตัวแปรตามคือ Neonatal Death ได้คำตอบเป็น Odds Ratio ภาพการวิเคราะห์ Meta Analysis ได้ถูกนำ มาเป็น Logo ของ The Cochrane Collaboration
==================================
ช่วงท้ายจะเป็นรายละเอียดของผู้คิด Module และวิธี Download Module มาใช้งาน
ขอบพระคุณครับ ได้ทบทวนวิธีการที่เคยได้เรียนรู้ครับ
http://www.thaihp.org/index.php?option=other_detail&lang=th&id=24&sub=26
อภิวิเคราะห์เบื้องต้น (ABC of Meta-analysis) | บทความการศึกษาต่อเนื่อง
สาวิตรี เกตุเอม, ภ.บ.
กลุ่มงานเภสัชกรรม โรงพยาบาลสมเด็จพระพุทธเลิศหล้า สมุทรสงคราม
เนติ สุขสมบูรณ์, PharmD, Ph D.
สาขาเภสัชกรรมคลินิก ภาควิชาเภสัชกรรม คณะเภสัชศาสตร์ มหาวิทยาลัยมหิดล
นลินี พูลทรัพย์, Ph.D.
ภาควิชาเภสัชกรรม คณะเภสัชศาสตร์ มหาวิทยาลัยศิลปากร
รหัส 1-000-HPT-000-0512-01
จำนวน 3 หน่วยกิตการศึกษาต่อเนื่อง
วันที่รับรอง : 11 ธันวาคม 2548
วันที่หมดอายุ : 10 ธันวาคม 2550
บทคัดย่อ
meta-analysis เป็นการใช้วิธีการทางสถิติในการรวมผลงานวิจัยตั้งแต่สองเรื่องเข้าด้วยกัน และเป็นส่วนหนึ่งของการทบทวนเอกสารอย่างเป็นระบบเชิงปริมาณ meta-analysis ถูกนำมาใช้อย่างกว้างขวาง ในการประเมินประสิทธิผลของวิธีต่างๆ ที่เกี่ยวข้องกับการดูแลสุขภาพ โดยการรวมผลที่ได้จากการศึกษาชนิด randomized controlled trial เข้าด้วยกัน ?ข้อดีของ meta-analysis คือ ให้ผลลัพธ์ในเชิงปริมาณที่ชัดเจนและแม่นยำขึ้น โดยเฉพาะในกรณีที่งานวิจัยให้ผลแตกต่างหรือขัดแย้งกัน นอกจากนี้ การรวมงานวิจัยเข้าด้วยกัน ทำให้มีความหลากหลายของกลุ่มตัวอย่าง จึงสามารถขยายผลไปใช้ในวงกว้างขึ้น บทความนี้กล่าวถึงขั้นตอนของ meta-analysis และการคำนวณพารามิเตอร์ที่เกี่ยวข้อง รวมทั้งปัญหาที่พบใน meta-analysis
คำสำคัญ : Meta-analysis, systematic reviews อภิวิเคราะห์ การทบทวนเอกสารอย่างเป็นระบบ
Journal Name: วารสารวิชาการสาธารณสุข ; Journal of Health Science
Volume: 10 Number: 1 ประจำเดือน มกราคม - มีนาคม 2544
Title(Thai): การทบทวนวรรณกรรมอย่างเป็นระบบเชิงปริมาณ : การวิเคราะห์ เมตา
Title(English): A Quantitative Systematic Review: Meta-analysis
Author: มาลินี เหล่าไพบูลย์ ; Malinee Laopaiboon
Category: บททบทวนพิเศษ
วารสารวิชาการสาธารณสุข มกราคม - มีนาคม 2544
บทความฉบับเต็ม
การทบทวนวรรณกรรมอย่างเป็นระบบเชิงปริมาณ : การวิเคราะห์เมตา
A Quantitative Systematic Review: Meta-analysis
บทคัดย่อไทย :
ปัจจุบันการทบทวนวรรณกรรมอย่างเป็นระบบเป็นวิธีการที่ใช้กันอย่างแพร่หลายในงานวิจัยทางด้านบริการการดูแลสุขภาพรายงานวิจัยที่ใช้วิธีการของการทบทวนวรรณกรรมอย่างมีระบบได้ปรากฏเป็นจำนวนมากมายในวารสารการวิจัยทางด้านบริการดูแลสุขภาพบทความนี้ต้องการนำเสนอวิธีการดังกล่าวเชิงปริมาณที่นิยมเรียกว่า ?การวิเคราะห์เมตา? วัตถุประสงค์หลักของการนำเสนอครั้งนี้เพื่อเสนอแนวความคิดโดยทั่วไปของการวิเคราะห์เมตา
คำสำคัญไทย :
การทบทวนวรรณกรรมอย่างเป็นระบบเชิงปริมาณ : การวิเคราะห์เมตา
English Abstract :
A Quantitative Systematic Review: Meta-analysis. Malinee Laopaiboon Department of Biostatistics and Demography, Faculty of Public Health, Khon Kaen University, Khon Kaen 40002, Thailand. Journal of Health Science 2000; 9:151-171. Systematic review is a common approach in health care research. There are increasing number of systematic review papers published in health care service journals. This article presents the methodology of systematic review in quantitative approach, which has been often called "meta-analysis". The main purpose was to provide readers with general considerations in conducting a meta-analysis.
English Keyword:
A Quantitative Systematic Review: Meta-analysis
http://www.pharm.chula.ac.th/tjps/ContentVol25No3_4/1Vol25No3-4Page81_89scan.pdf
Journal Name: วารสารวิชาการสาธารณสุข ; Journal of Health Science
Volume: 10 Number: 1 ประจำเดือน มกราคม - มีนาคม 2544
Title(Thai): การทบทวนวรรณกรรมอย่างเป็นระบบเชิงปริมาณ : การวิเคราะห์ เมตา
Title(English): A Quantitative Systematic Review: Meta-analysis
Author: มาลินี เหล่าไพบูลย์ ; Malinee Laopaiboon
Category: บททบทวนพิเศษ
วารสารวิชาการสาธารณสุข มกราคม - มีนาคม 2544
บทความฉบับเต็ม
http://stat32.tripod.com/state1.pdf
Meta Analysis แบบ Pooled Odds Ratio
Peto Method, Mantel Haenszel Method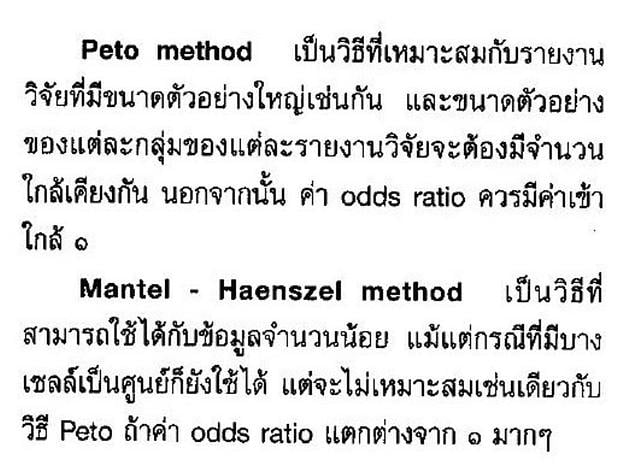
http://stat32.tripod.com/state1.pdf
ขอบคุณคะอาจารย์ ตอนนี้ STATA รุ่น 11 มีคำสั่งสำหรับ meta-analysis ในตัวแล้วค่อยยังชั่ว
จากภาพที่นำมา Post ไว้เมื่อ 2 ปีก่อน
เรื่อง Pooled Odds Ratio, Fixed Effect, Peto's Method
และ Mantel-Haenszel Method (M-H)
ข้อความในภาพ น่าจะคลาดเื่คลื่อนไม่ถูกต้อง อาจเกิดจากพิมพ์ผิดครับ
Inverted Variance (I-V) เป็นวิธีมาตรฐาน แต่ใช้ไม่ได้ถ้า cell ของ 2x2 table มีค่าเป็น 0
Mantel-Haenszel (M-H) ใช้ได้ดีกับกลุ่มตัวอย่างขนาดเล็ก
Peto's Method (Peto) ยังคงสามารถใช้ได้ แม้ว่าcell ของ 2x2 table มีค่าเป็น 0
Odds Ratio, Fixed Effect, Random Effect, Heterogeneity,
http://www.gotoknow.org/posts/519108
เข้ามาอ่านหาความรู้ค่ะ
กราบขอบพระคุณอาจารย์มากเลยค่ะ ยิ่งอ่านยิ่งได้ความรู้ค่ะ
กาญจนา